
New Paper Published
Attributing temperature changes to synoptic frequency
Attributing temperature changes to synoptic frequency
Posted by Jim Stagge on October 07, 2016
Our new paper, titled “A probabilistic approach for attributing temperature changes to synoptic type frequency”, has been published online today by the International Journal of Climatology. This research presents a new method to assess whether observed temperature trends can be attributed to changes in synoptic frequency, i.e. whether “warm” circulation patterns have become more frequent, causing increased temperatures. If synoptic frequency cannot eplain all of the observed warming, then “within-type” changes must have a significant effect. This could mean a general warming of some or all circulation types, rather than a change in frequency.
The method is entirely probabilistic, using a Monte Carlo resampling technique and distribution tests to determine the statistical significance of changes. Performing these calculations in a probabilistic framework with significance/confidence intervals is an interesting improvement on the previous “hypothetical trend” method that relied on a single index.
An example is provided for Europe, where we found:
- widespread warming throughout Europe (70% by area for annual temperature), particularly in the summer
- severe warming in high latitudes (Scandinavia) during the winter
- within-type changes were important for much of the summer (April-August)
- changes due to synoptic frequency alone were more localized, but particularly important at transitional months, May in western Europe and Aug/Sep in the Baltics/Scandinavia.
You can find the full paper (open access) here:
Nilsen, I.B., Stagge, J.H., Tallaksen, L.M. (2016) "A probabilistic approach for attributing temperature changes to synoptic type frequency" International Journal of Climatology, 10.1002/joc.4894.
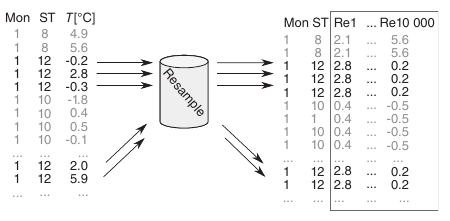
Fig. 1. Reproduced from article. Example of how to calculate synoptic-circulation-induced time series using the probabilistic approach by resampling.
Abstract
To understand the cause of regional temperature change, it is common to separate the temperature change signal into changes in atmospheric synoptic circulation and other factors, so-called within-type changes. In this study, we suggest a novel probabilistic approach that allows detection of months and regions where temperature changes can mainly be attributed to changes in synoptic circulation and where within-type changes also play a role. By combining resampling with a Monte Carlo test, we assess the likelihood that the observed warming can be explained by synoptic circulation changes alone. This method is applicable for any variable, and in any region of the world. We applied it to an example case using gridded WATCH Forcing Data ERA-Interim (WFDEI) temperature data and synoptic types derived from the SynopVis Grosswetterlagen catalogue (1981–2010). For this European example, the most widespread warming was found in summer, with up to 60% of the land area experiencing significant warming during August, notably in Eastern and Northern Europe. In spring and autumn, this area was reduced to 10–30%. In December and January, only about 5% of the land area experienced significant warming, most pronounced in northern Scandinavia. The probabilistic approach revealed that changes in synoptic circulation could not account for all the observed (WFDEI) warming, with the exception of regions in southeastern Europe in February and Western Europe in May. Significant warming in other months and regions, such as the large-scale warming in April, June, July, August, and November, must also be caused by other factors. Within-type changes were confirmed for the Black Sea region in November, where the magnitude of a widespread temperature trend was strongest. This European example contributes to an improved understanding of the causes of recent temperature change by assessing the relative role of synoptic circulation changes and within-type changes on regional-scale warming.
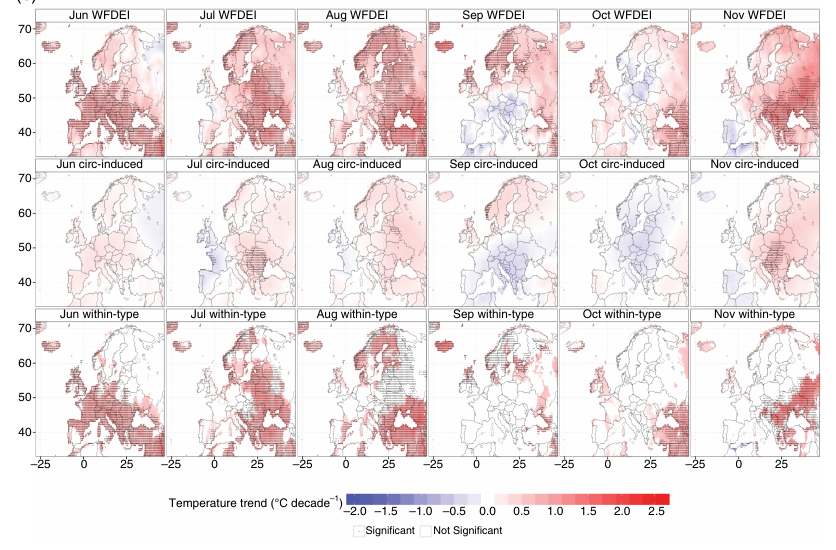
Fig. 3. Reproduced from article. WFDEI trends for the summer and autumn. Top row: WFDEI temperature trends for the period 1981–2010. Dots mark significant WFDEI trends. Middle row: median of the (resampled) synoptic-circulation-induced trends (mSC). Dots mark significant synoptic-circulation-induced temperature trends. Bottom row: as the top row, but with white regions to indicate where the Monte Carlo test is accepted (i.e. explained by synoptic circulation changes alone), coloured regions where the null hypothesis is rejected (i.e. other factors play a role).