New Paper Published
Five decades of warming: impacts on snow cover in Norway
Five decades of warming: impacts on snow cover in Norway
Posted by Jim Stagge on September 01, 2017
Our new paper, titled “Five decades of warming: impacts on snow cover in Norway”, has been published online today by the journal Hydrology Research. This study analyzes recent trends in snow cover extent (SCE) over Norway, comparing this with climate trends. The largest changes in SCE occurred during the end of the snow season (spring) for all regions except in high elevations. SCE for all of Norway decreased by more than 20,000 km2 (6% of the land area) between the periods 1961–1990 and 1981–2010.
You can read the full paper here:
Rizzi, J., Brox-Nilsen, I., Stagge, J.H., Gisnas, K. and Tallaksen, L.M. (2017) "Five decades of warming: impacts on snow in Norway" Hydrology Research, 10.2166/nh.2017.051
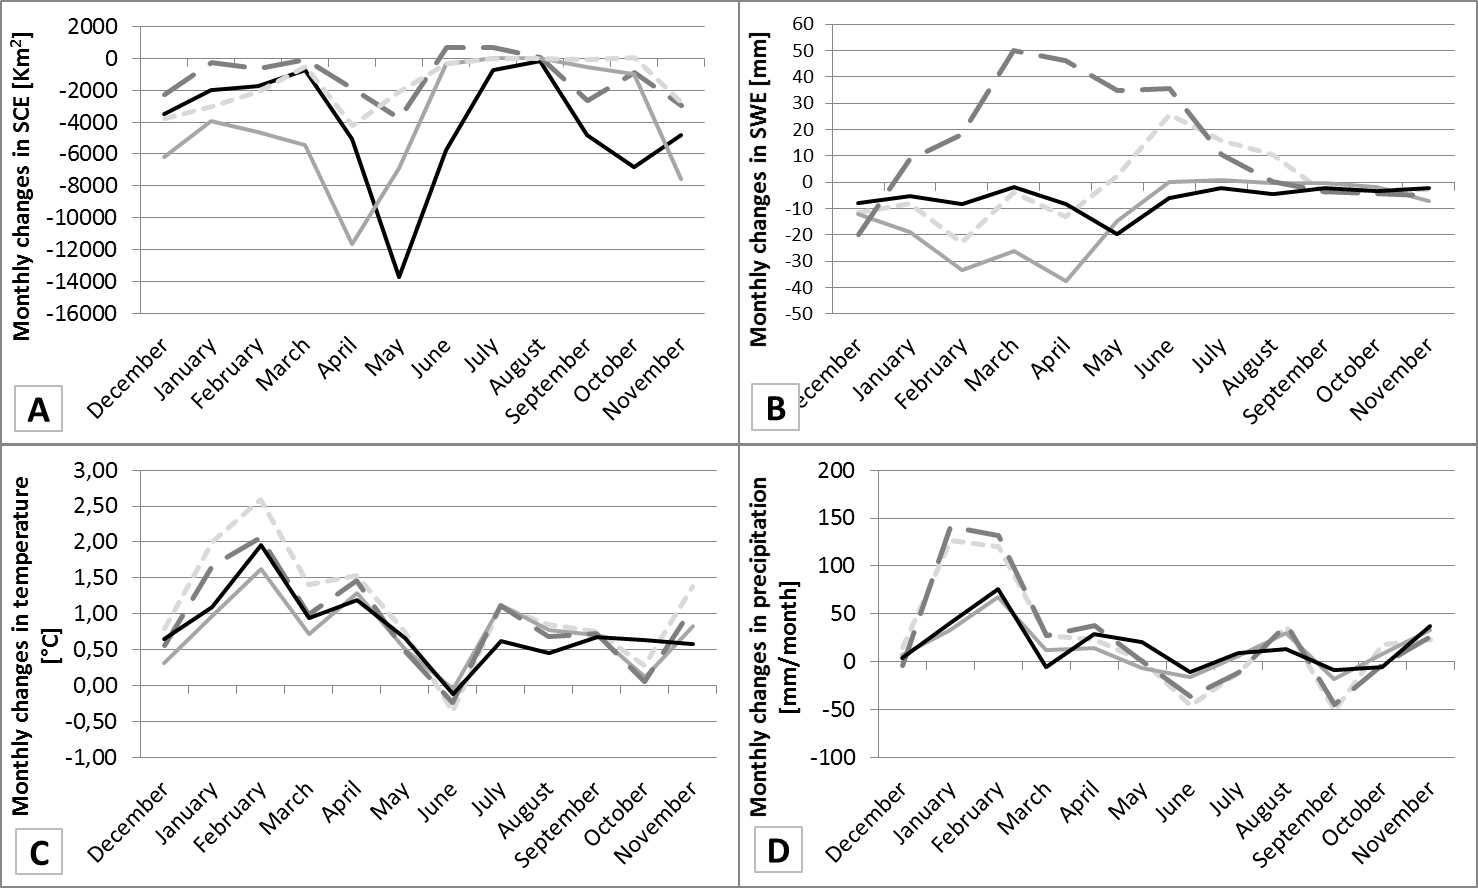
Fig. 5. Reproduced from article. Difference in mean monthly values between 1981–2010 and the reference period 1961–1990 in each macro region for: SCE (a), regSWE (b), temperature (c) and precipitation (d).
Abstract
Northern latitudes are experiencing faster warming than other regions in the world, which is partly explained by the snow albedo feedback. In Norway, mean temperatures have been increasing since the 1990s, with 2014 being the warmest year on record, 2.2 °C above normal (1961–1990). At the same time, a concurrent reduction in the land area covered by snow has been reported. In this study, we present a detailed spatial and temporal (monthly and seasonal) analysis of trends and changes in snow indices based on a high resolution (1 km) gridded hydro-meteorological dataset for Norway (seNorge). During the period 1961–2010, snow cover extent (SCE) was found to decrease, notably at end of the snow season, with a corresponding decrease in snow water equivalent except at high elevations. SCE for all Norway decreased by more than 20,000 km2 (6% of the land area) between the periods 1961–1990 and 1981–2010, mainly north of 63 ° N. Overall, air temperature increased in all seasons, with the highest increase in spring (particularly in April) and winter. Mean monthly air temperatures were significantly correlated with the monthly SCE, suggesting a positive land–atmosphere feedback enhancing warming in winter and spring.
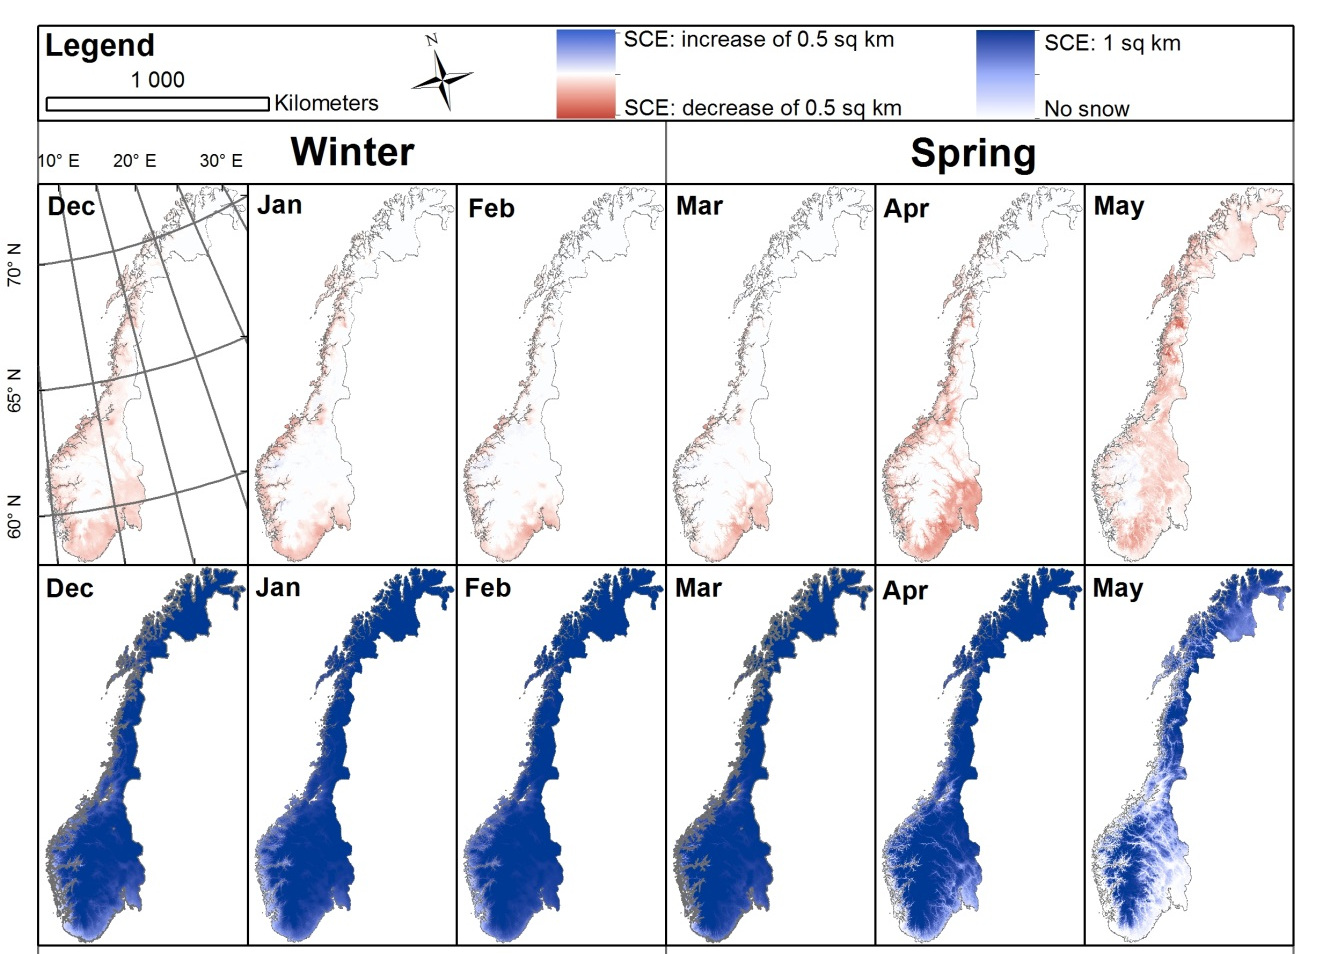
Fig. 3. Reproduced from article. Difference in mean monthly SCE (km2) between 1981–2010 and 1961–1990 (first row). Mean absolute monthly SCE (km2) for 1961–1990 shown for reference (second row).