New Publication
Expected Annual Minima
Expected Annual Minima from an Idealized Moving-Average Drought Index
Posted by Jim Stagge on February 07, 2025
Access the paper: Expected annual minima from an idealized moving-average drought index
I am pleased to announce the publication of our recent study titled “Expected Annual Minima from an Idealized Moving-Average Drought Index”, which delves into the theoretical probability of annual minima based on moving-average drought indices, such as the Standardized Precipitation Index (SPI).
Study Overview
Many drought indices are derived from the SPI and employ a moving-average structure to normalize hydroclimate variables and measure drought severity. In this study, we developed a stochastic model to simulate over 10 million years of daily and monthly SPI values, allowing us to derive the theoretical distribution of annual exceedance probabilities. Our findings mark the first explicit quantification of annual extreme exceedances from a moving-average process with a long window, relative to the annual period.
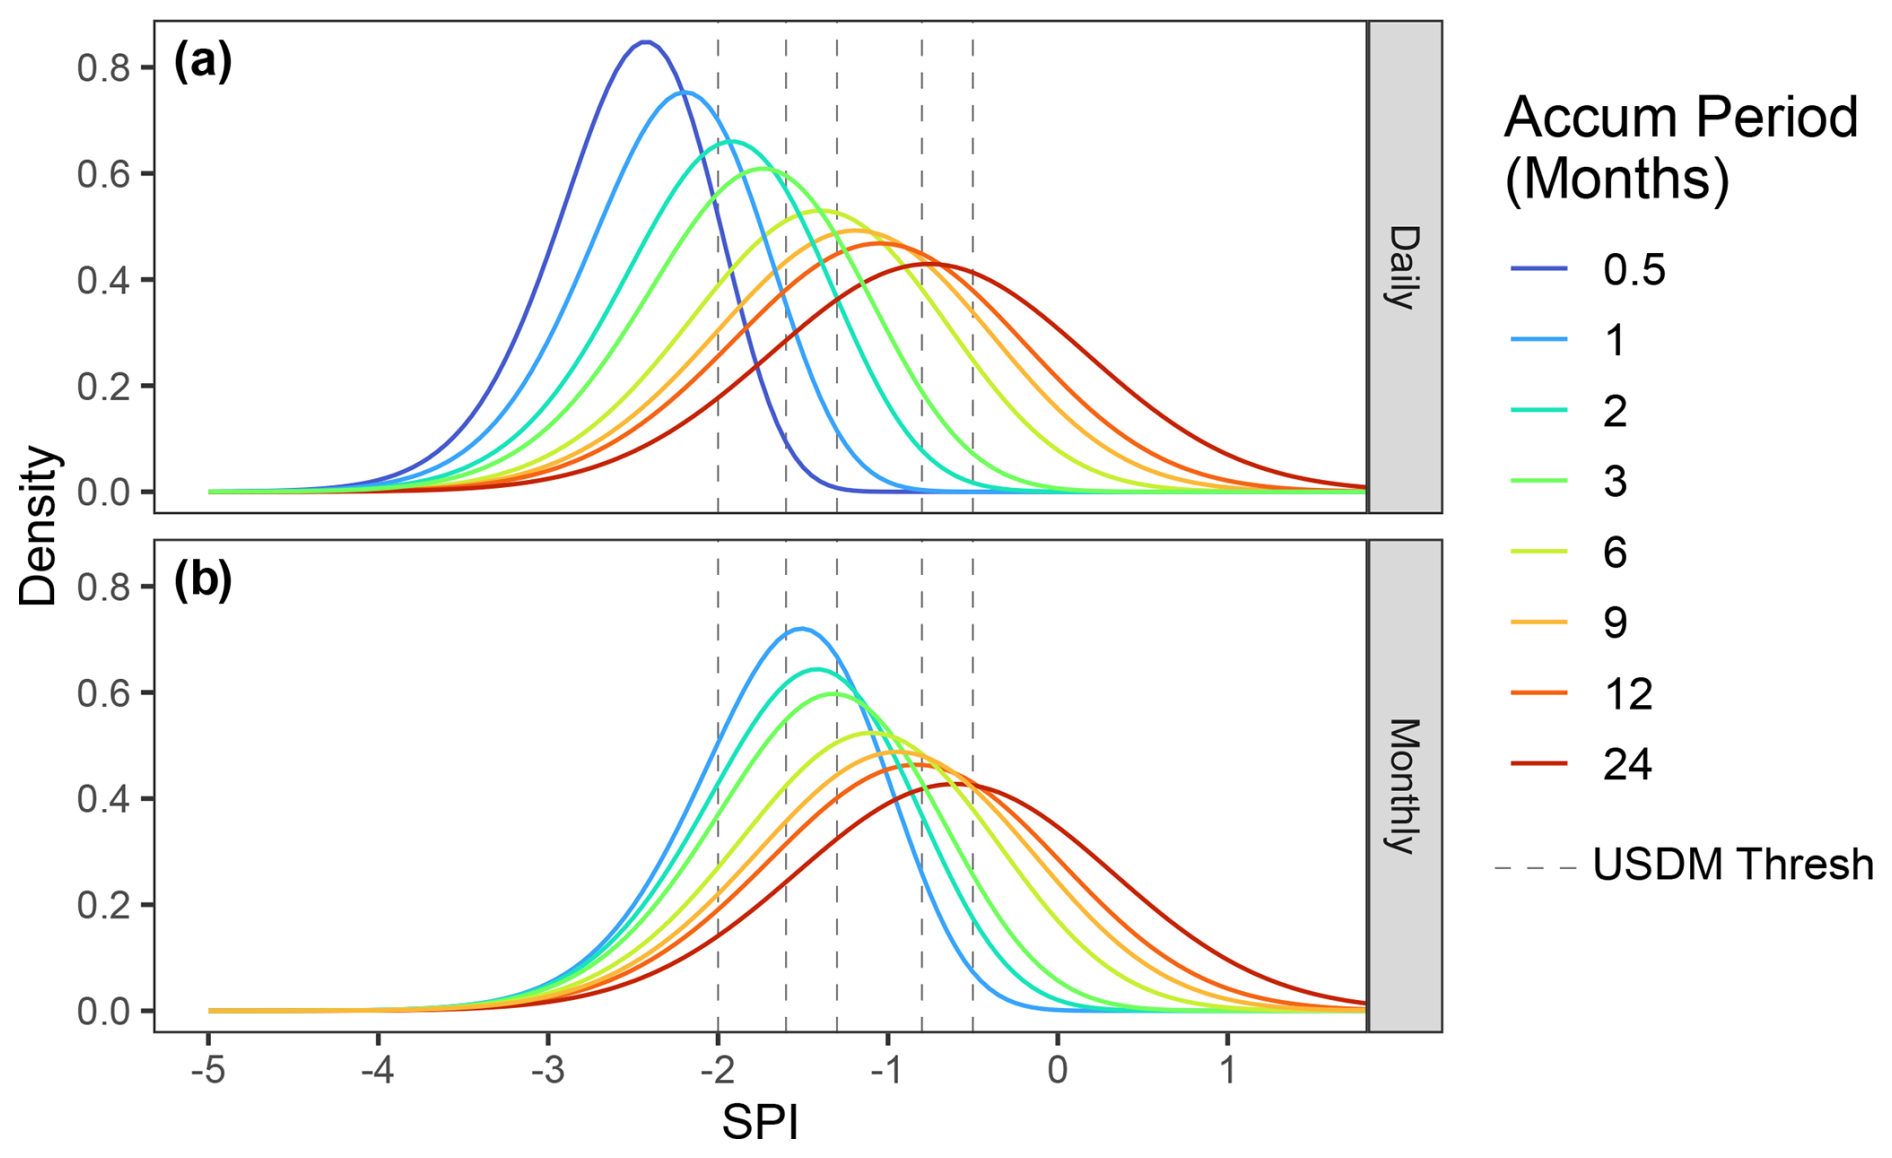
Fiitted distribution of annual minima from daily (a) and monthly (b) time series.
Key Findings
- The distribution of annual minima from a moving-average process follows a generalized normal distribution, rather than the expected generalized extreme-value (GEV) distribution derived from extreme-value theory.
- We provide expected annual return periods for the SPI and related drought indices, with accumulation periods ranging from 1 to 24 months.
- The study demonstrates that the annual return period varies depending on both the accumulation period and the temporal resolution (daily or monthly). Notably, the likelihood of exceeding an SPI threshold decreases as the accumulation period increases.
Implications for Drought Risk Assessment
The results of this study provide valuable clarification for the use of moving-average drought indices in risk assessment. Our work challenges some conventional interpretations of annual drought return periods and provides a more nuanced understanding of drought extremes.
Access the Publication
The full publication is available in [Hydrology and Earth System Sciences](https://hess.copernicus.org/articles/29/719/2025/).
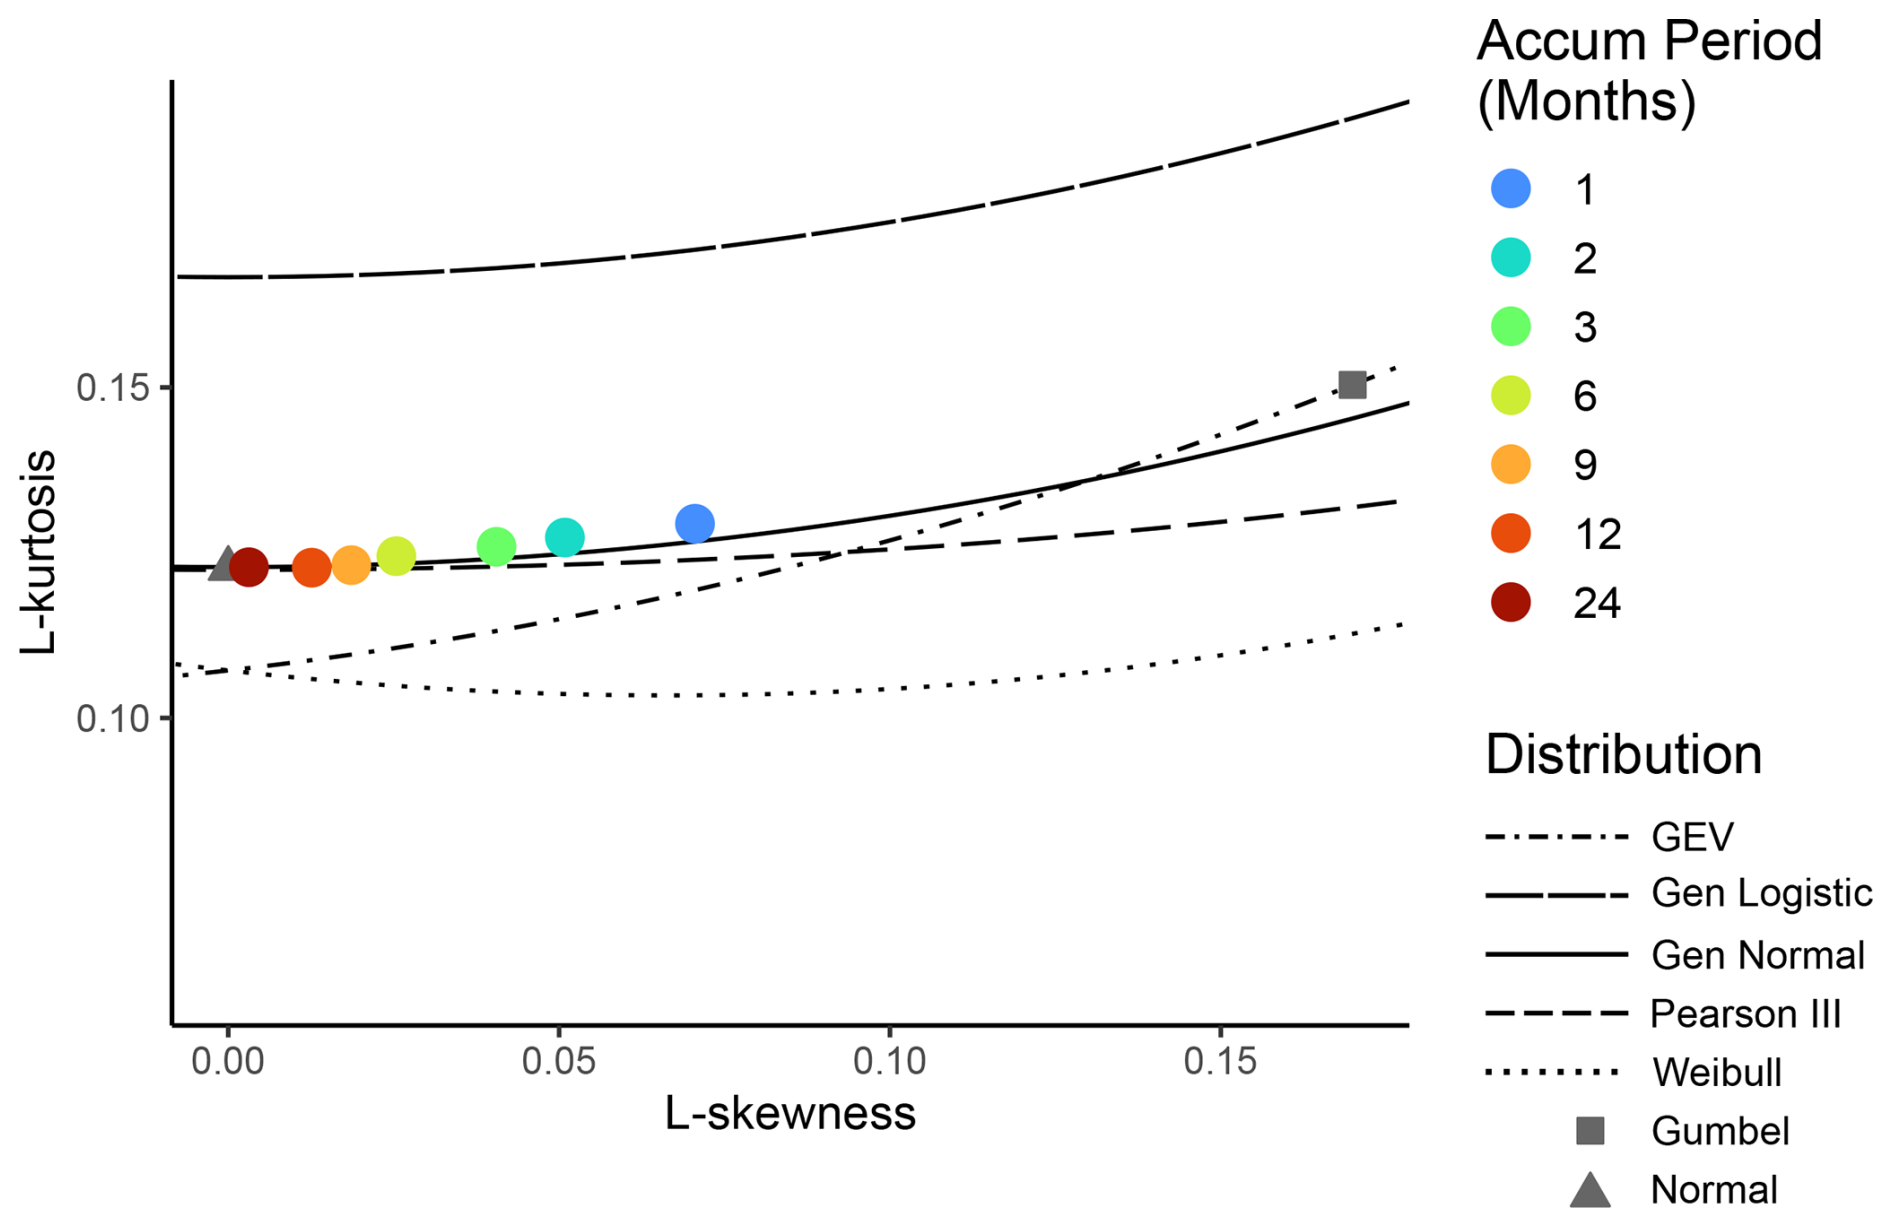
L-moment ratios for annual extremes from monthly simulated series. Coloured points refer to fitted moments across varying accumulation periods, while lines correspond to theoretical distributions. Note that this figure shows distributions with a flipped sign. True skewness for annual minima is negative.